
In August, the production of crude coal, crude oil, natural gas and electricity in industries above designated size (hereinafter referred to as regulated industries) grew steadily.
I. Crude coal, crude oil and natural gas production and related information
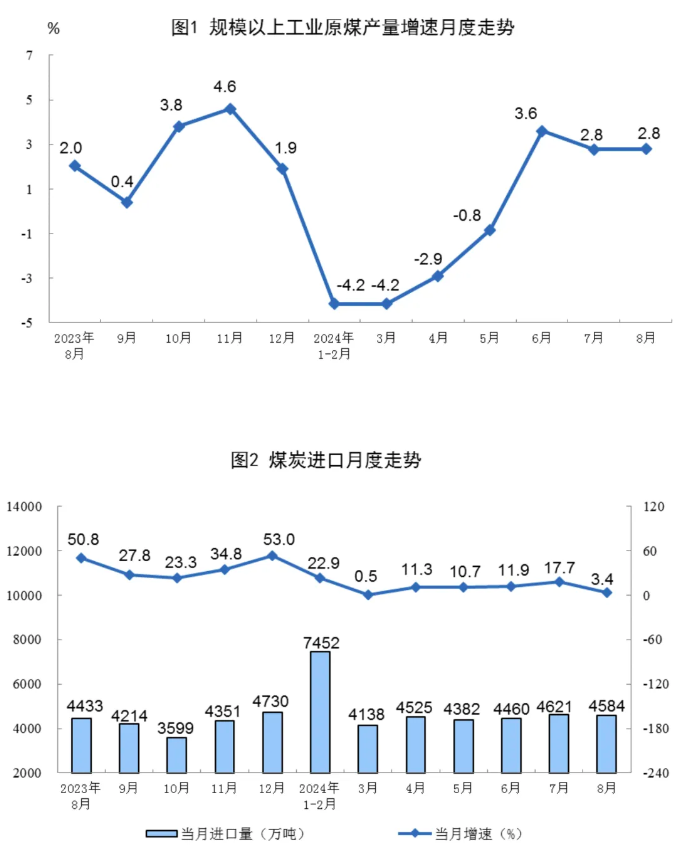
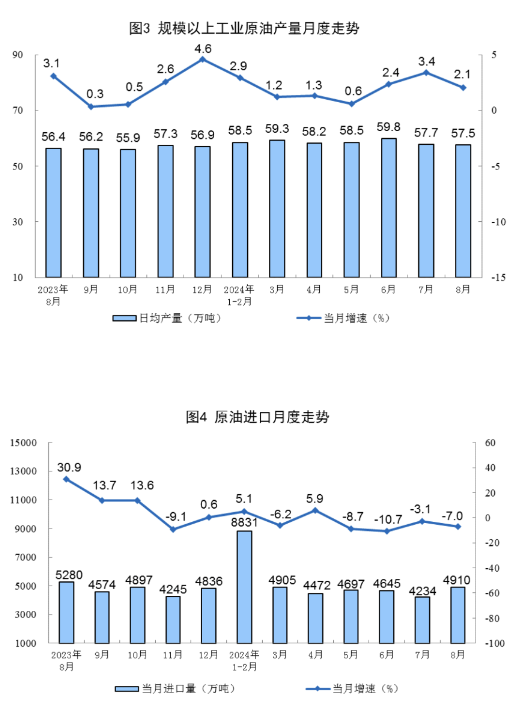
Raw coal production grew steadily. in August, the regulation industry raw coal production of 400 million tons, an increase of 2.8%, the growth rate is the same as in July; average daily production of 12.792 million tons. Imported coal 45.84 million tons, up 3.4%.
From January to August, the regulation industry raw coal production of 3.05 billion tons, down 0.3%. 340 million tons of imported coal, up 11.8%.
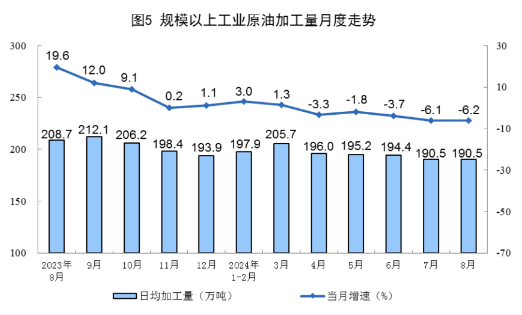
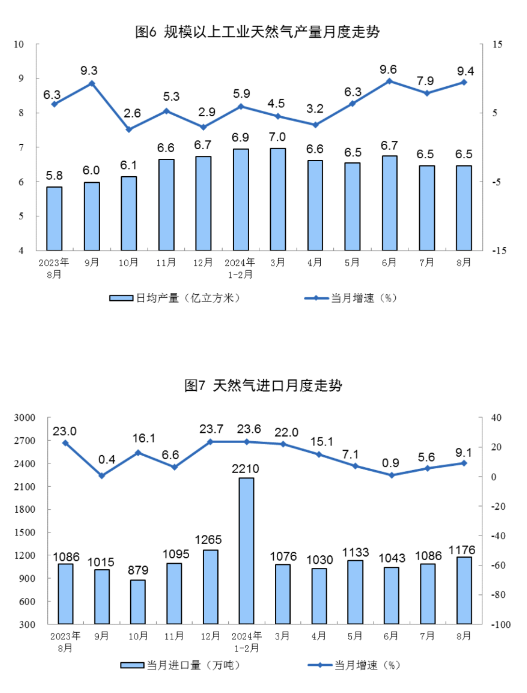
Crude oil production grew steadily. in August, the regulation industry crude oil production of 17.83 million tons, an increase of 2.1%; average daily production of 575,000 tons. Imported 49.1 million tons of crude oil, down 7.0%.
From January to August, the regulation of industrial crude oil production of 142.79 million tons, an increase of 2.1%. 366.91 million tons of imported crude oil, a year-on-year decline of 3.1%.
Crude oil processing has declined. in August, the on-board industrial crude oil processing volume of 59.07 million tons, a year-on-year decline of 6.2%; average daily processing of 1.905 million tons. from January to August, the on-board industrial crude oil processing volume of 472.53 million tons, a year-on-year decrease of 1.2%.
Natural gas production accelerated. in August, regulated industrial natural gas production of 20 billion cubic meters, an increase of 9.4%, the growth rate than in July accelerated by 1.5 percentage points; the average daily production of 650 million cubic meters. Imported natural gas 11.76 million tons, up 9.1%.
From January to August, regulated industrial natural gas production of 163.7 billion cubic meters, an increase of 6.6%. 87.13 million tons of imported natural gas, an increase of 12.3%.
II. Electricity production
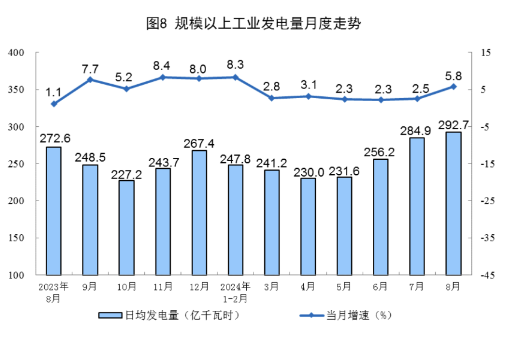
Regulated industrial power production accelerated. in August, regulated industrial power generation 907.4 billion kilowatt-hours, up 5.8%, the growth rate accelerated by 3.3 percentage points compared to July; regulated industrial power generation 29.27 billion kilowatt-hours per day. in January-August, regulated industrial power generation 6,237.9 billion kilowatt-hours, an increase of 5.1%.
Sub-species, in August, the industrial thermal power from decline to increase, hydropower growth rate fell, nuclear power, wind power,solar powerGrowth rate accelerated. Among them, the industrial thermal power on a year-on-year growth of 3.7%, July for a decline of 4.9%; industrial hydropower on a year-on-year growth of 10.7%, the growth rate of 25.5 percentage points lower than in July; on a year-on-year growth of nuclear power on a year-on-year growth of 4.9%, the growth rate accelerated by 0.6 percentage points compared to July; on a year-on-year growth of wind power on a year-on-year growth of 6.6%, the growth rate of 5.7 percentage points accelerated than July 5.7 percentage points; industrial solar power growth of 21.7%, the growth rate of 5.3 percentage points faster than in July.
footnote
1. Interpretation of indicators
Average daily product output: It is calculated by dividing the total output of industrial enterprises above designated size published in the month by the number of calendar days in the month.
2. Statistical coverage
The statistical caliber of the production data in the report are all above-scale industries, and its statistical scope is industrial enterprises with annual main business income of 20 million yuan and above.
As the scope of industrial enterprises above designated size changes every year, in order to ensure that the data of the current year is comparable with the previous year, the number of the same period used to calculate the year-on-year growth rate of product output and other indicators is consistent with the scope of enterprise statistics of the current period, and the caliber differences in the data published in the previous year.
3. Data sources
Import data is from the General Administration of Customs, of which August 2024 data is flash data.
4. Natural gas unit conversion relationship: 1 ton is approximately equal to 1,380 cubic meters.
Special notice: Goodhao is reproduced from other websites for the purpose of transmitting more information rather than for profit, and at the same time does not mean to endorse its views or confirm its description, the content is for reference only. Copyright belongs to the original author, if there is infringement, please contact us to delete.