
In May, the production of crude coal, crude oil, natural gas and electricity in industries above designated size (hereinafter referred to as regulated industries) remained stable.
I. Crude coal, crude oil and natural gas production and related information
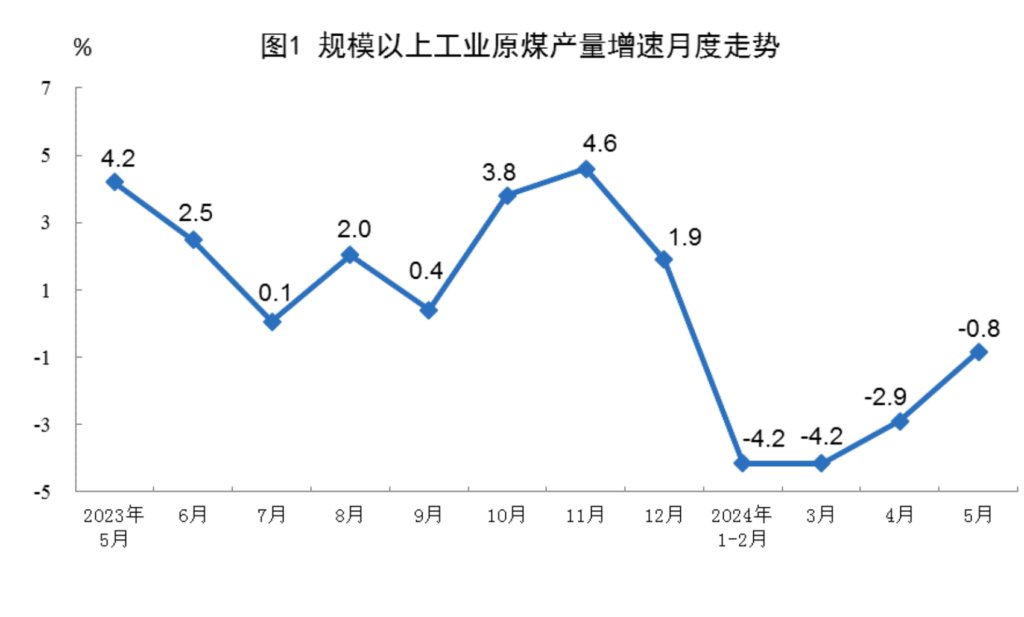
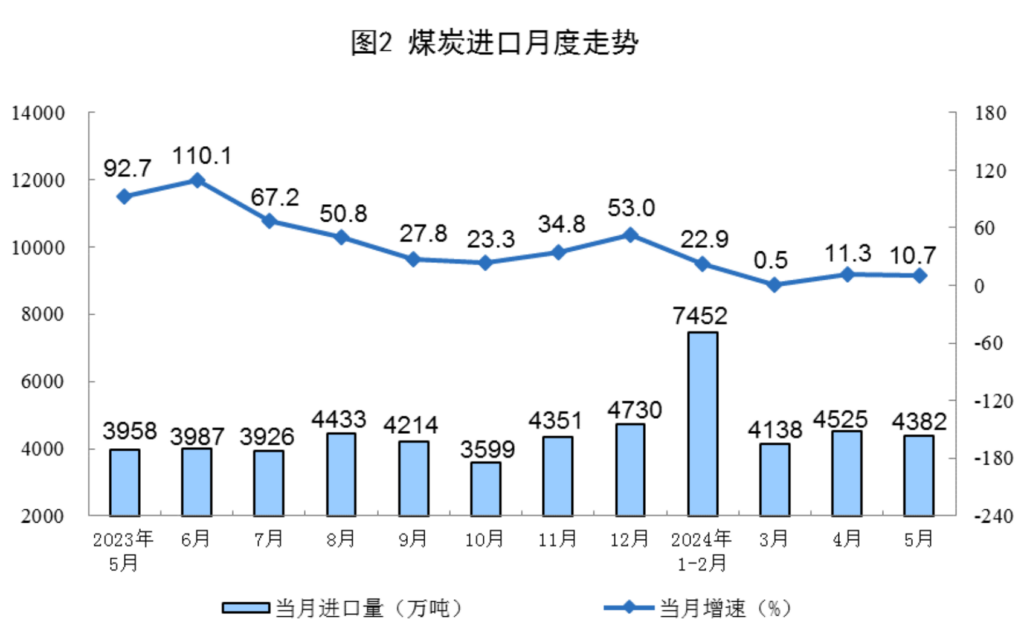
Raw coal production decline continues to narrow, imports to maintain faster growth. in May, the regulation of industrial raw coal production of 380 million tons, down 0.8%, a decline of 2.1 percentage points narrower than in April; average daily production of 12.382 million tons. Imported coal 43.82 million tons, up 10.7%.
From January to May, the regulation industry raw coal production of 1.86 billion tons, down 3.0%. 200 million tons of imported coal, up 12.6%.
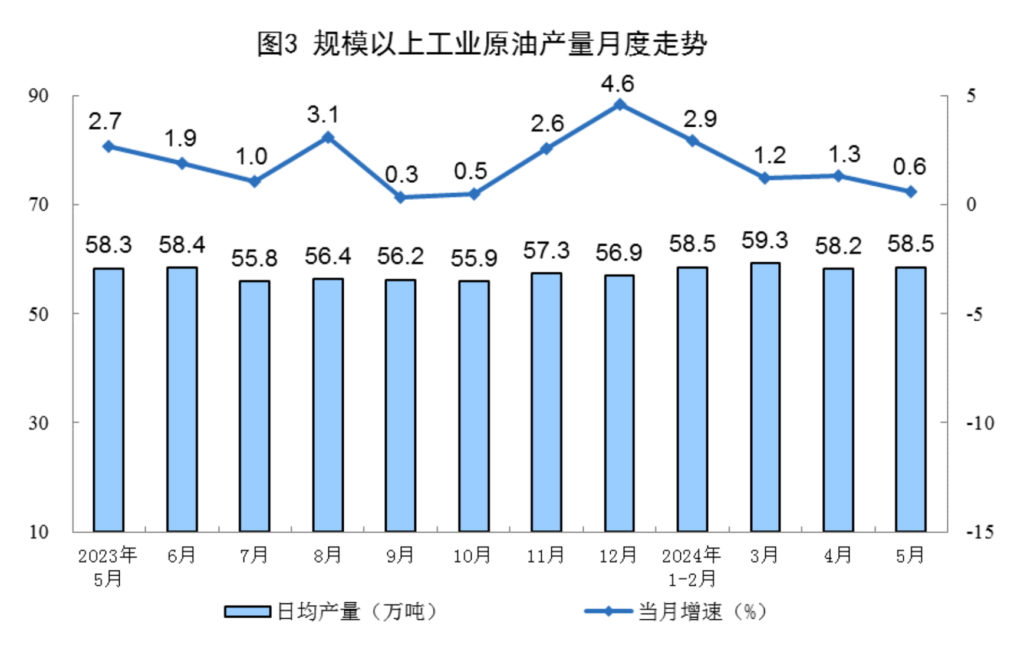
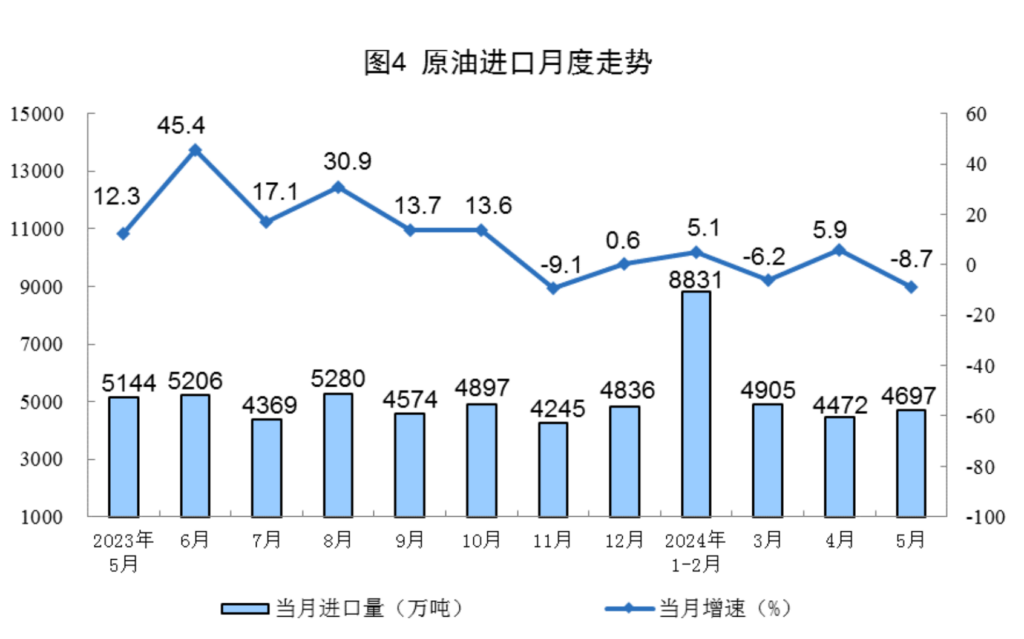
Crude oil production grew steadily, imports from increase to decline. 18.15 million tons of crude oil production in May, industrial crude oil production on the regulation, an increase of 0.6%, the growth rate than in April slowed down by 0.7 percentage points; average daily production of 585,000 tons. Imports of crude oil 46.97 million tons, down 8.7%.
From January to May, the regulated industry crude oil production of 89.1 million tons, an increase of 1.8%. 229.03 million tons of imported crude oil, a year-on-year decline of 0.4%.
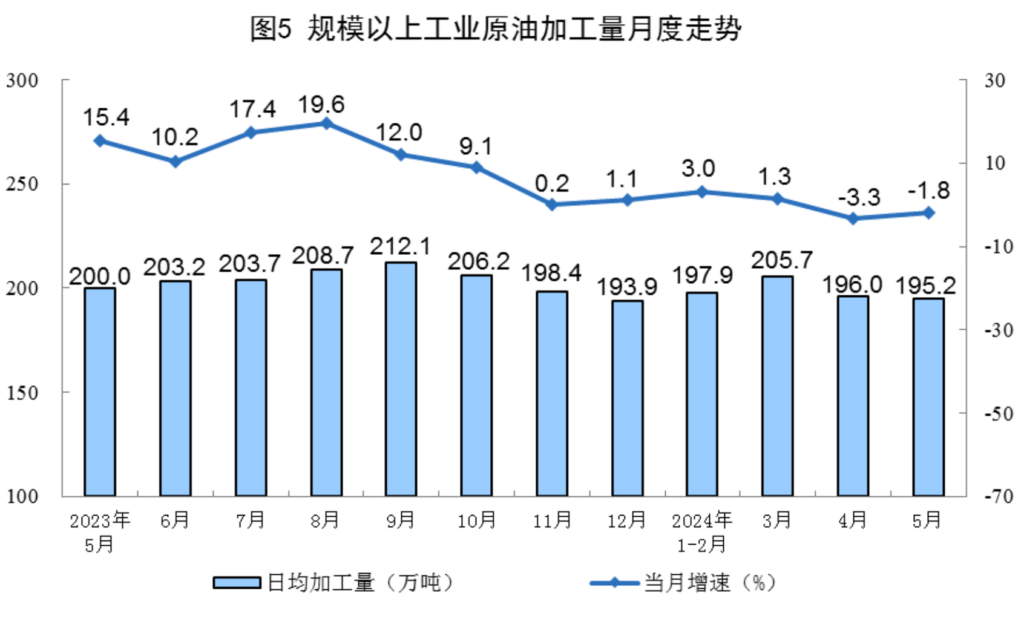
Crude oil processing decline narrowed. in May, the on-board industrial crude oil processing volume of 60.52 million tons, down 1.8%, down 1.5 percentage points narrower than in April; average daily processing of 1.952 million tons. from January to May, the on-board industrial crude oil processing volume of 301.77 million tons, an increase of 0.3%.
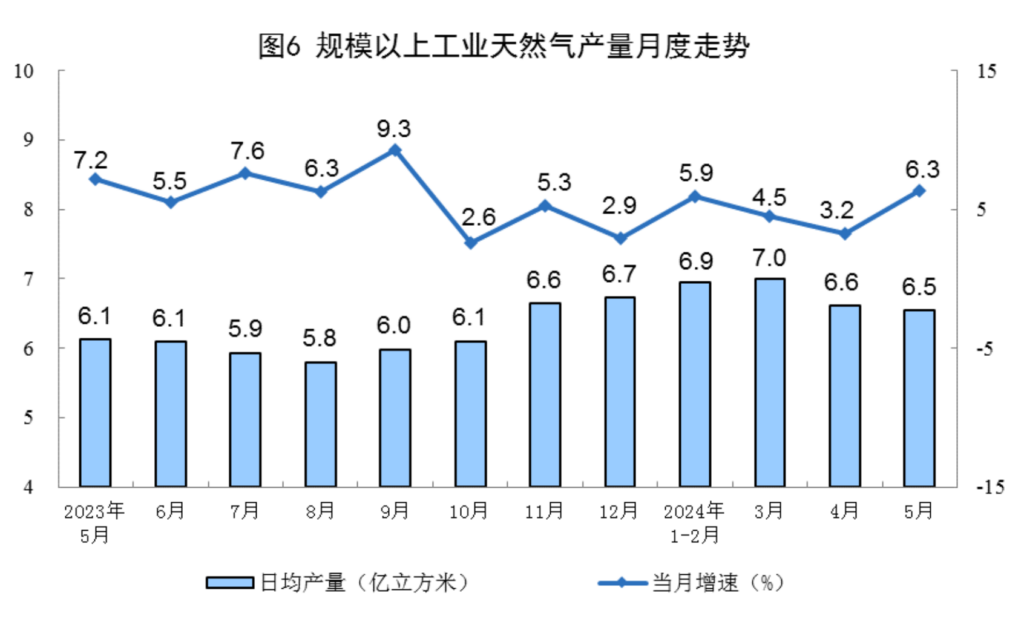
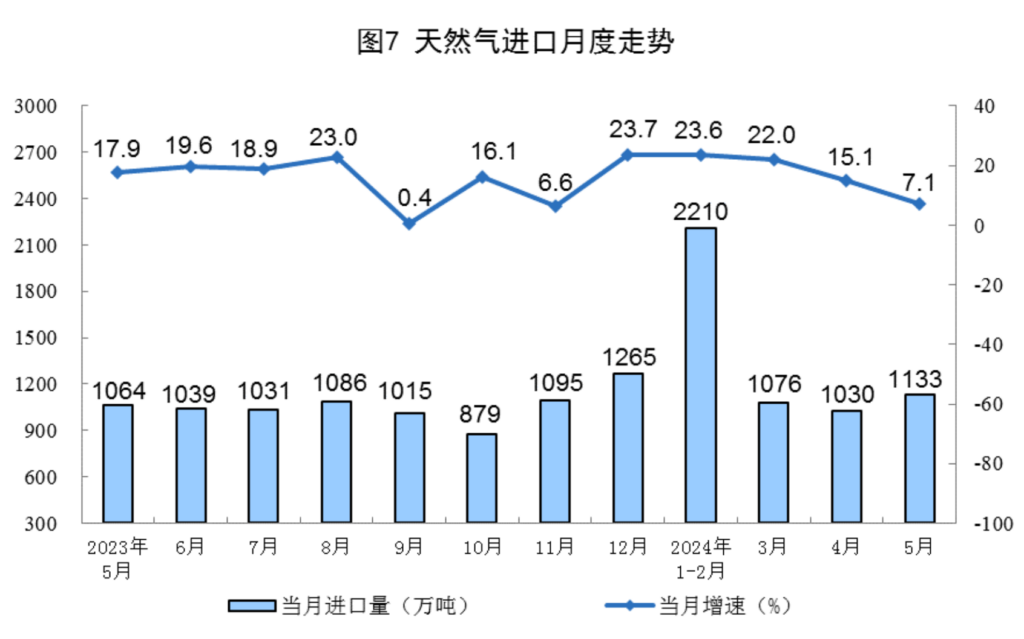
Natural gas production steady growth, imports to maintain faster growth. in May, the regulation of industrial natural gas production of 20.3 billion cubic meters, an increase of 6.3%, the growth rate than in April accelerated by 3.1 percentage points; the average daily production of 6.5 billion cubic meters. Imported natural gas 11.33 million tons, up 7.1%.
From January to May, regulated industrial natural gas production of 103.3 billion cubic meters, up 5.2%. 54.28 million tons of imported natural gas, up 17.4%.
II. Electricity production
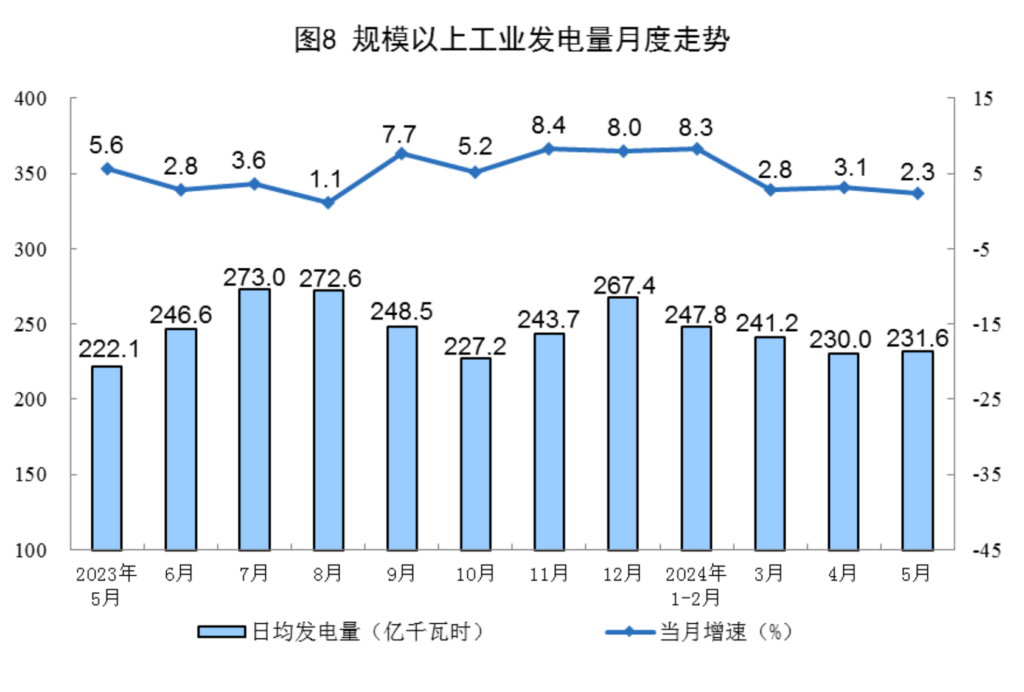
Regulated industrial power production remained stable. in May, regulated industrial power generation capacity of 717.9 billion kWh, up 2.3% year-on-year, the growth rate slowed down by 0.8 percentage points compared with April; regulated industrial power generation of 23.16 billion kWh per day. from January to May, regulated industrial power generation capacity of 3,657 billion kWh, up 5.5% year-on-year.
Sub-species, in May, industrial thermal power, nuclear power from increase to decrease, hydropower, solar power growth accelerated, wind power decline narrowed. Among them, industrial thermal power on a year-on-year decline of 4.3%, April for the growth of 1.3%; industrial hydropower on a year-on-year growth of 38.6%, the growth rate accelerated by 17.6 percentage points over April; on a year-on-year decline of industrial nuclear power of 2.4%, April for the growth of 5.9%; on a year-on-year decline of industrial wind power of 3.3%, the decline rate narrowed compared to April 5.1 percentage points; industrial solar power on a regular basis grew 29.1%, the growth rate of 7.7 percentage points faster than in April.
footnote
1. Interpretation of indicators
Average daily product output: It is calculated by dividing the total output of industrial enterprises above designated size published in the month by the number of calendar days in the month.
2. Statistical coverage
The statistical caliber of the production data in the report are all above-scale industries, and its statistical scope is industrial enterprises with annual main business income of 20 million yuan and above.
As the scope of industrial enterprises above designated size changes every year, in order to ensure that the data of the current year is comparable with the previous year, the number of the same period used to calculate the year-on-year growth rate of product output and other indicators is consistent with the scope of enterprise statistics of the current period, and the caliber differences in the data published in the previous year.
3. Data sources
Import data are from the General Administration of Customs, of which May 2024 data are flash data.
4. Natural gas unit conversion relationship: 1 ton is approximately equal to 1,380 cubic meters.
Special notice: Goodhao is reproduced from other websites for the purpose of transmitting more information rather than for profit, and at the same time does not mean to endorse its views or confirm its description, the content is for reference only. Copyright belongs to the original author, if there is infringement, please contact us to delete.