
On March 17, the National Bureau of Statistics released the January-February 2025renewable energyProduction. Among them, in January-February, the industrial wind power growth rate accelerated, hydropower, nuclear power, solar power generation growth slowed down, thermal power decline expanded. Among them, the industrial thermal power on a year-on-year decline of 5.8%, the rate of decline than in December last year to expand by 3.2 percentage points; industrial hydropower on a year-on-year growth of 4.5%, the growth rate slowed down by 1.0 percentage points; on a year-on-year growth of industrial nuclear power of 7.7%, the growth rate slowed down by 3.7 percentage points; on a year-on-year growth of industrial wind power 10.4%, the growth rate accelerated by 3.8 percentage points; Regulated industrial solar power generation growth of 27.4%, the growth rate slowed down by 1.1 percentage points.
See below for details:
Energy production in January-February 2025
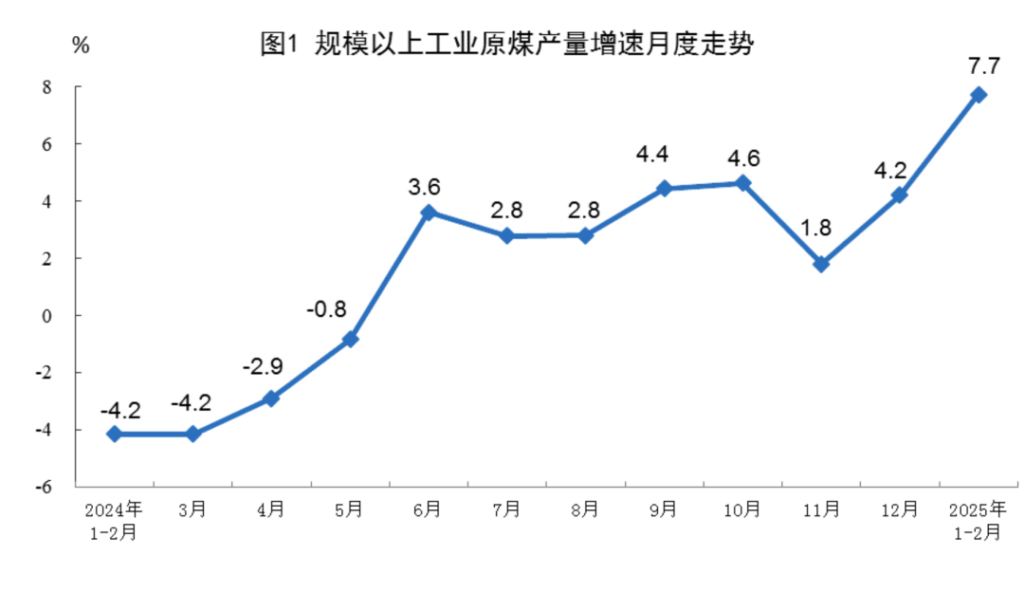
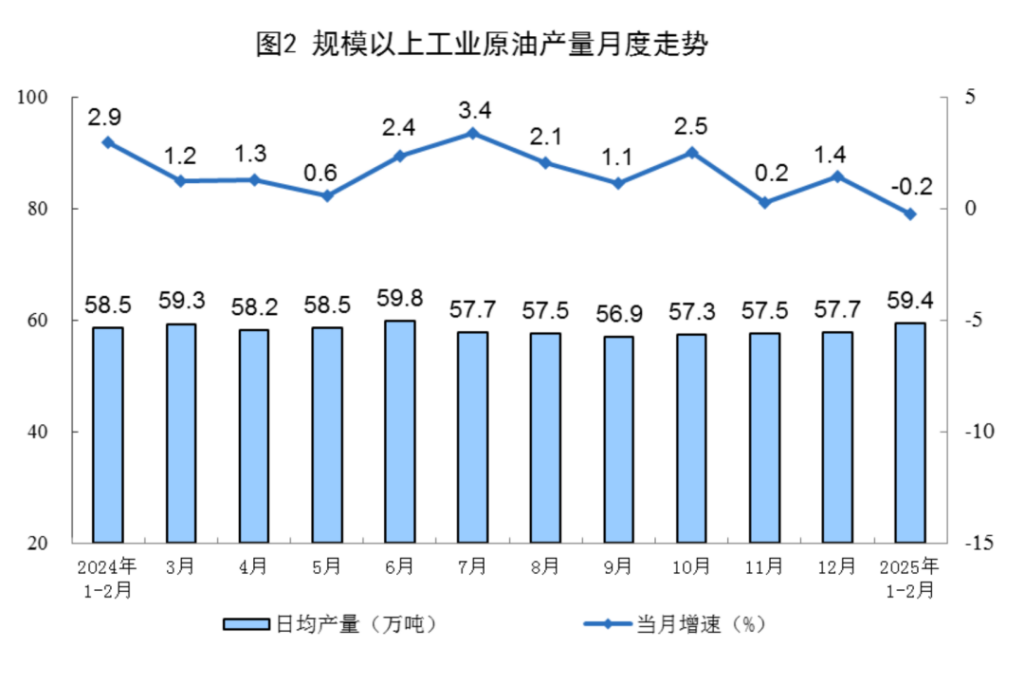
In January-February, the growth rate of raw coal and natural gas production in industries above designated size (hereinafter referred to as regulated industries) accelerated, while crude oil and electricity production was basically stable.
I. Crude coal, crude oil and natural gas production and related information
Raw coal production growth rate accelerated. 1-2 months, the regulation of industrial raw coal production of 770 million tons, an increase of 7.7%, the growth rate than in December last year accelerated by 3.5 percentage points; average daily production of 12.97 million tons.
Crude oil production is basically stable. 1-2 months, the regulation of industrial crude oil production of 35.04 million tons, a year-on-year decline of 0.2%; average daily production of 594,000 tons.
Crude oil processing growth rate accelerated. 1-2 months, the on-board industrial crude oil processing volume of 119.17 million tons, an increase of 2.1%, the growth rate than the previous year in December accelerated by 1.5 percentage points; average daily processing of 2.02 million tons.

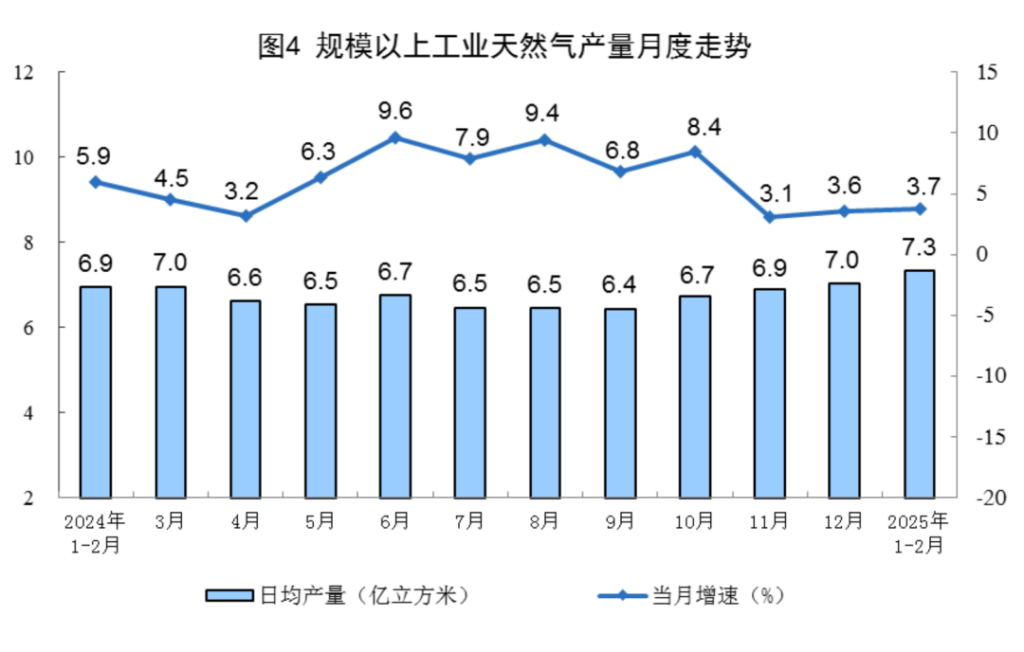
Stable growth in natural gas production. 1-2 months, regulated industrial natural gas production of 43.3 billion cubic meters, an increase of 3.7%, the growth rate than the previous year in December accelerated by 0.1 percentage points; the average daily output of 7.3 billion cubic meters.
II. Electricity production
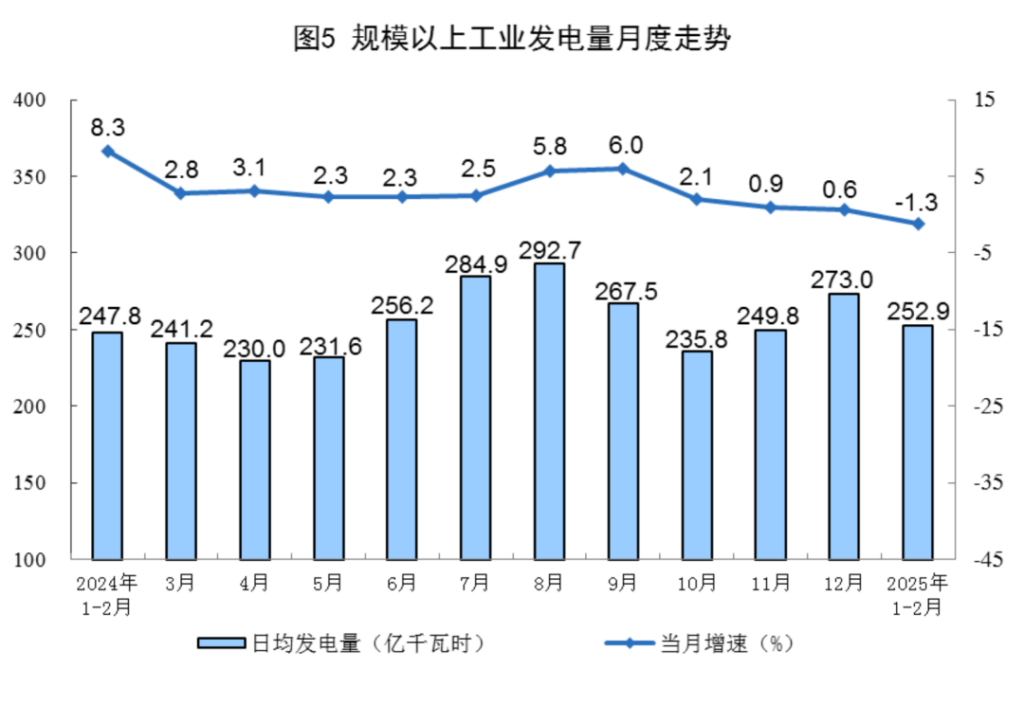
Regulated industrial power production declined slightly. in January-February, the regulated industrial power generation capacity of 14,921 million kWh, down 1.31 TP3T; average daily power generation of 25.29 billion kWh, up 0.41 TP3T.
Sub-species, 1-2 months, industrial wind power growth rate accelerated, hydropower, nuclear power, solar power growth slowed down, thermal power decline expanded. Among them, the industrial thermal power year-on-year decline of 5.8%, the rate of decline than in December last year to expand by 3.2 percentage points; industrial hydropower growth of 4.5%, the growth rate slowed down by 1.0 percentage points; industrial nuclear power growth of 7.7%, the growth rate slowed down by 3.7 percentage points; industrial wind power growth of 10.4%, the growth rate accelerated by 3.8 percentage points; Regulated industrial solar power generation growth of 27.4%, the growth rate slowed down by 1.1 percentage points.
footnote
1. Interpretation of indicators
Average daily product output: It is calculated by dividing the total output of industrial enterprises above designated size published in the month by the number of calendar days in the month.
2. Statistical coverage
The statistical caliber of the production data in the report are all above-scale industries, and its statistical scope is industrial enterprises with annual main business income of 20 million yuan and above.
As the scope of industrial enterprises above designated size changes every year, in order to ensure that the data of the current year is comparable with the previous year, the number of the same period used to calculate the year-on-year growth rate of product output and other indicators is consistent with the scope of enterprise statistics of the current period, and the caliber differences in the data published in the previous year.
3. Natural gas unit conversion relationship: 1 ton is approximately equal to 1,380 cubic meters.
Special notice: Goodhao is reproduced from other websites for the purpose of transmitting more information rather than for profit, and at the same time does not mean to endorse its views or confirm its description, the content is for reference only. Copyright belongs to the original author, if there is infringement, please contact us to delete.